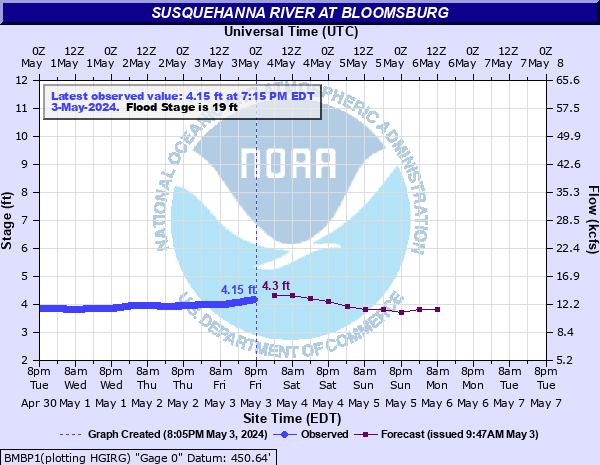
Susquehanna River at Bloomsburg
Critical Stages
16' - Action
19' - Flood
22' - Moderate
28' - Major
Latest Observation
Updated: 9:15 AM EST 12/14/25
Status: No Flooding
Stage: 1.58 ft
Flow: 4.08 kcfs
Forecast
| Time | Stage (ft) | Flow (kcfs) |
|---|---|---|
| 1 PM 12/14 | 1.3 | 3.42 |
| 7 PM 12/14 | 1.2 | 3.19 |
| 1 AM 12/15 | 1.2 | 3.19 |
| 7 AM 12/15 | 1.2 | 3.19 |
| 1 PM 12/15 | 1.2 | 3.19 |
| 7 PM 12/15 | 1.2 | 3.19 |
| 1 AM 12/16 | 1.2 | 3.19 |
| 7 AM 12/16 | 1.1 | 2.97 |
| 1 PM 12/16 | 1.1 | 2.97 |
| 7 PM 12/16 | 1.1 | 2.97 |
| 1 AM 12/17 | 1.1 | 2.97 |
| 7 AM 12/17 | 1.1 | 2.97 |
| Time | Stage (ft) | Flow (kcfs) |
|---|---|---|
| 10:15 AM 12/14 | 1.57 | 4.05 |
| 10:00 AM 12/14 | 1.58 | 4.08 |
| 9:45 AM 12/14 | 1.58 | 4.08 |
| 9:30 AM 12/14 | 1.58 | 4.08 |
| 9:15 AM 12/14 | 1.58 | 4.08 |
| 9:00 AM 12/14 | 1.59 | 4.1 |
| 8:45 AM 12/14 | 1.59 | 4.1 |
| 8:30 AM 12/14 | 1.59 | 4.1 |
| 8:15 AM 12/14 | 1.59 | 4.1 |
| 8:00 AM 12/14 | 1.6 | 4.12 |
| 7:45 AM 12/14 | 1.6 | 4.12 |
| 7:30 AM 12/14 | 1.6 | 4.12 |
| 7:15 AM 12/14 | 1.61 | 4.15 |
| 7:00 AM 12/14 | 1.61 | 4.15 |
| 6:45 AM 12/14 | 1.61 | 4.15 |
| 6:30 AM 12/14 | 1.61 | 4.15 |
| 6:15 AM 12/14 | 1.61 | 4.15 |
| 6:00 AM 12/14 | 1.62 | 4.17 |
| 5:45 AM 12/14 | 1.62 | 4.17 |
| 5:30 AM 12/14 | 1.62 | 4.17 |
| 5:15 AM 12/14 | 1.62 | 4.17 |
| 5:00 AM 12/14 | 1.63 | 4.2 |
| 4:45 AM 12/14 | 1.62 | 4.17 |
| 4:30 AM 12/14 | 1.62 | 4.17 |
| 4:15 AM 12/14 | 1.62 | 4.17 |
| 4:00 AM 12/14 | 1.62 | 4.17 |
| 3:45 AM 12/14 | 1.62 | 4.17 |
| 3:30 AM 12/14 | 1.62 | 4.17 |
| 3:15 AM 12/14 | 1.62 | 4.17 |
| 3:00 AM 12/14 | 1.61 | 4.15 |
39.5' -
Flood waters begin to reach the Rupert Drive Bridge in Catawissa.
36.5' -
FEMA 0.2 0X0P+0nnual Chance Flood Level (500-year flood).
32.8' -
Flood of record from Tropical Storm Lee in 2011.
32.3' -
Flood of record from Hurricane Agnes in 1972.
32' -
Bloomsburg high school is affected by flood waters.
30' -
Most areas south of 10th Street and west of Railroad Street are affected by high water. Flood waters inundate more than 25 percent of Bloomsburg.
29.5' -
FEMA 1 0X0P+0nnual Chance Flood Level (100-year flood).
28' -
A large part of Bloomsburg south of 10th Street and west of Railroad Street is affected by high water.
26' -
Much of the runway at the airport is inundated. High water begins to affect the sewage treatment plant and the race track at the fairgrounds.
24' -
Much of the fairgrounds, as well as adjacent areas, are affected by high water. High water also begins to affect the runway at the airport.
22.5' -
FEMA 10 0X0P+0nnual Chance Flood Level (10-year flood).
22' -
A number of homes located between the fairgrounds and the river are affected by high water. Several buildings at the airport are also affected.
20' -
High water affects the fairgrounds and the surrounding area.
19' -
High water affects homes along River Road.
| Date | Stage (ft) |
|---|---|
| Sep 9, 2011 | 32.75 |
| Mar 9, 1904 | 32.7 |
| Jun 25, 1972 | 31.2 |
| Jun 28, 2006 | 28.64 |
| Mar 18, 1865 | 28.2 |
| Mar 19, 1936 | 27.8 |
| Sep 27, 1975 | 27.5 |
| Sep 19, 2004 | 27.12 |
| Mar 3, 1902 | 26.9 |
| Jan 21, 1996 | 26.860000610352 |
| Apr 2, 1940 | 25.7 |
| Mar 9, 1979 | 25.2 |
| May 29, 1946 | 25.2 |
| Apr 4, 2005 | 25.09 |
| Apr 6, 1984 | 24.4 |
| Dec 15, 1983 | 24.2 |
| Mar 11, 1964 | 24 |
| Feb 14, 1984 | 23.5 |
| Mar 16, 1986 | 23.4 |
| Jan 1, 1943 | 23.4 |
Data provided by the National Weather Service.