« Back to Cabarrus County Rivers
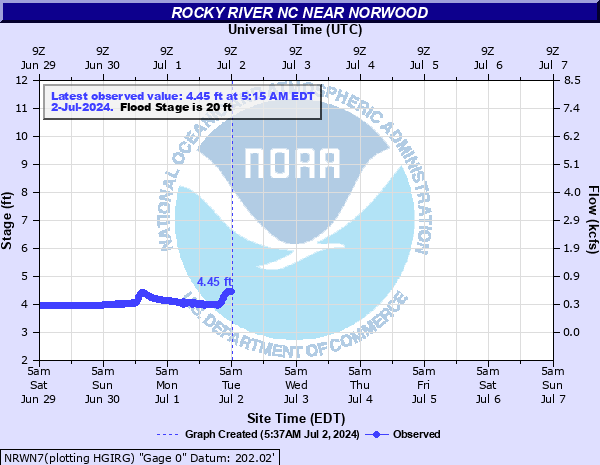
Rocky River NC near Norwood
Critical Stages
16' - Action
20' - Flood
30' - Moderate
34' - Major
Latest Observation
Updated: 10:15 AM EST 12/14/25
Status: No Flooding
Stage: 4.01 ft
Flow: 0.16 kcfs
Forecast
Forecast not available for this location.
| Time | Stage (ft) | Flow (kcfs) |
|---|---|---|
| 10:30 AM 12/14 | 4.02 | 0.164 |
| 10:15 AM 12/14 | 4.01 | 0.16 |
| 10:00 AM 12/14 | 4.03 | 0.167 |
| 9:45 AM 12/14 | 4.01 | 0.16 |
| 9:30 AM 12/14 | 4.04 | 0.171 |
| 9:15 AM 12/14 | 4.05 | 0.174 |
| 9:00 AM 12/14 | 4.06 | 0.178 |
| 8:45 AM 12/14 | 4.05 | 0.174 |
| 8:30 AM 12/14 | 4.09 | 0.189 |
| 8:15 AM 12/14 | 4.03 | 0.167 |
| 8:00 AM 12/14 | 4.01 | 0.16 |
| 7:45 AM 12/14 | 4 | 0.157 |
| 7:30 AM 12/14 | 4.04 | 0.171 |
| 7:15 AM 12/14 | 4.04 | 0.171 |
| 7:00 AM 12/14 | 4.07 | 0.182 |
| 6:45 AM 12/14 | 4.08 | 0.185 |
| 6:30 AM 12/14 | 4.08 | 0.185 |
| 6:15 AM 12/14 | 4.08 | 0.185 |
| 6:00 AM 12/14 | 4.08 | 0.185 |
| 5:45 AM 12/14 | 4.09 | 0.189 |
| 5:30 AM 12/14 | 4.08 | 0.185 |
| 5:15 AM 12/14 | 4.08 | 0.185 |
| 5:00 AM 12/14 | 4.08 | 0.185 |
| 4:45 AM 12/14 | 4.08 | 0.185 |
| 4:30 AM 12/14 | 4.08 | 0.185 |
| 4:15 AM 12/14 | 4.08 | 0.185 |
| 4:00 AM 12/14 | 4.08 | 0.185 |
| 3:45 AM 12/14 | 4.08 | 0.185 |
| 3:30 AM 12/14 | 4.08 | 0.185 |
| 3:15 AM 12/14 | 4.08 | 0.185 |
44' -
Water reaches Plank Rd, where flooding is likely on the Anson County side of the Plank Rd Bridge.
34' -
Major flooding begins. There is widespread flooding of pasture and farmland.
30' -
Moderate flooding begins. There is widespread flooding of pasture and lowlands adjacent to the river.
27' -
The parking lot at the Anson County boat access on the will begin to flood.
20' -
Minor flood stage. There is significant overflow into adjacent pasture and lowlands.
16' -
Action Stage. The river begins to overflow its banks in some areas upstream of the gage site.
| Date | Stage (ft) |
|---|---|
| Sep 18, 1945 | 46.37 |
| Sep 17, 2018 | 46.08 |
| Aug 1, 1908 | 35 |
| Aug 31, 1952 | 34 |
| Apr 1, 1973 | 33.16 |
| Oct 11, 1990 | 32.93 |
| Oct 2, 1989 | 32.81 |
| Apr 7, 1936 | 32 |
| Feb 7, 2020 | 31.64 |
| Oct 2, 1929 | 31.4 |
| Nov 23, 2006 | 30.8 |
| Aug 9, 2024 | 29.3 |
| Mar 1, 1987 | 29.11 |
| Oct 16, 1964 | 29.11 |
| Mar 24, 1989 | 28.68 |
| Jan 11, 1984 | 27.54 |
| Sep 27, 2024 | 26.29 |
| Feb 12, 2023 | 26.13 |
| Aug 18, 1985 | 25.14 |
| Jan 25, 2010 | 25.07 |
Data provided by the National Weather Service.